
Paid media reporting is the systematic process of collecting, analysing, and acting on paid advertising data to connect spend with measurable business outcomes. Most marketing teams still report on clicks, impressions, and click-through rates. Those numbers tell you what the platform did. They do not tell you whether your budget generated revenue. The discipline of paid media reporting, properly applied, closes that gap by linking Google Ads and Meta Ads spend to metrics like Customer Acquisition Cost (CAC), and Return on Ad Spend (ROAS).
SCOPE works with service-based businesses every day to build reporting frameworks that answer the question every business owner actually cares about: is this spend working?
What are the key paid media reporting metrics to track in 2026?
Effective paid media reporting focuses on business-level outcome metrics rather than platform-level outputs. The seven core KPIs listed below will give you a complete picture of your campaign health and business impact.
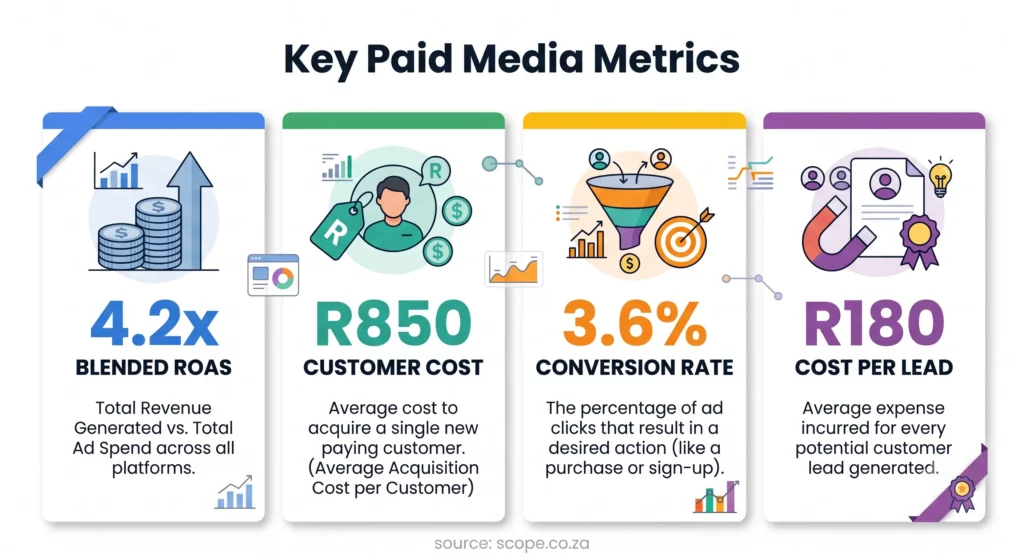
- Blended ROAS measures total revenue generated divided by total ad spend across all channels.
- Customer Acquisition Cost (CAC) is the total spend divided by the number of new customers acquired. Tracking CAC over time reveals whether your paid media is becoming more or less efficient.
- Conversion rates by funnel stage show where prospects drop off. A high click-through rate with a low lead-to-sale conversion rate points to a landing page or sales process problem, not a media problem.
- Cost per Qualified Lead (CpQL) filters out low-intent enquiries. A lead that never converts is not worth counting, and CpQL gives you better insight into your true lead costs.
- View-through conversions capture users who saw an ad but converted later through a different channel. Ignoring them understates the contribution of awareness-stage campaigns.
- Quality Score (Google Ads) signals ad relevance and landing page experience. A low Quality Score raises your cost per click and reduces impression share.
- Cross-platform incrementality measures the net lift your campaigns generate above what would have happened organically. It is the most honest measure of true paid media impact.
Vanity metrics like raw impressions and total clicks are not useless. They become dangerous when treated as performance indicators rather than diagnostic signals. Google Ads CPCs have risen 134% over the past decade, with average cost per acquisition rising 12.35% year-over-year.
If your reporting only tracks clicks, you will miss the fact that each click now costs considerably more while conversion rates have declined to an average of 3.75% – 4.40% for search campaigns as of March 2026.
Focusing on 5–7 core metrics, each with a defined action threshold, delivers far more clarity than tracking every available data point. More metrics do not equal better decisions.

Pro Tip: Set a specific action threshold for each KPI before the campaign launches. For example: “If CpQL exceeds R850, pause the lowest-performing ad set and reallocate budget.” This turns your reporting from a record of activity into a decision-making tool.
| Metric | What it measures | Why it matters |
|---|---|---|
| Blended ROAS | Revenue per rand of total spend | Reflects true cross-channel return |
| CAC | Cost to acquire one new customer | Tracks efficiency over time |
| CpQL | Cost per qualified lead | Filters out unqualified leads |
| View-through conversions | Assisted conversions from ad exposure | Captures awareness-stage impact |
| Cross-platform incrementality | Net lift above organic baseline | Confirms true campaign causality |
Note: Reliable CpQL and CAC figures depend on accurate Google Ads conversion tracking feeding clean data upstream.
How should you structure paid media reports for different audiences?
Professional paid media reports must be tiered by audience to maximise clarity and decision impact. A report built for a performance marketer will overwhelm a CEO. A report built for a CEO will frustrate a media buyer. The structure of your reporting determines whether decisions actually get made.
Daily reports serve marketing and optimisation teams. They contain ad-level data: spend pacing, cost per click by ad group, Quality Score changes, frequency by audience segment, and conversion volume by campaign. The purpose is rapid diagnosis and same-day action.
Weekly reports serve marketing directors and channel leads. They shift focus to trends rather than individual data points. Budget pacing against monthly targets, week-on-week changes in CpQL, and creative performance comparisons belong here. Directors need to understand whether the channel is on track, not whether a single ad set had a bad Tuesday.
Quarterly reports serve executives and business owners. Board-ready reports contain a narrative explaining the data, a record of decisions made, a risk register, upcoming tests, and a pipeline attribution chain from spend to closed-won revenue. CAC trends, LTV:CAC ratios, and contribution margin belong at this level. The goal is to connect paid media activity to business outcomes in language that a CFO or CEO can act on.
| Report type | Who it’s for | Core content | Frequency |
|---|---|---|---|
| Ad-level report | Media buyers, performance marketers | Spend, CPC, Quality Score, conversions | Daily |
| Channel report | Marketing directors | CpQL trends, budget pacing, creative performance | Weekly |
| Executive report | CEOs, CFOs, business owners | CAC, LTV:CAC, pipeline attribution, narrative | Quarterly |
The narrative layer is what most reports miss entirely. Data without context produces confusion. A quarterly report that shows CAC increased by 18% needs to explain why, what decision was made in response, and what the expected outcome is. Reporting that serves as proof of activity rather than a basis for decisions wastes everyone’s time.
What are the common challenges in paid media reporting?
Platform-native dashboards prioritise output metrics like clicks and CTR because those metrics respond to bid dynamics and keep advertisers engaged. They are not designed to show you net revenue or pipeline contribution. Those metrics live in your CRM or backend systems, and connecting them to platform data requires deliberate reconciliation.
Attribution gaps are the most damaging challenge in paid media analytics. Cookieless tracking environments and cross-device user behaviour mean that platform-reported conversions can overstate impact significantly. A user who sees a Meta Ad on their phone, searches on their laptop, and converts through a Google Ad may be counted as a conversion by both platforms. Your CRM records one sale. The platforms record two conversions. Reconciling Ad platform data against CRM records is easier once you’ve set up offline conversion tracking correctly.
Reporting gaps due to cookieless tracking can cause 30 – 50% over-reporting if platform conversions are not reconciled with backend transaction data. That level of inflation makes budget decisions unreliable.
Pro Tip: Reconcile your platform conversion data against your CRM or backend sales records every day, not weekly. Discrepancies caught early are easy to investigate. Discrepancies discovered at month-end become arguments about which number is correct.
How do you turn paid media data into decisions?
Paid media analytics only creates value when each metric connects to a specific action. The discipline is asking “so what?” for every number in your report.
Identify the anomaly. A sudden drop in conversion rate on a Google Ads search campaign is not a conclusion. It is a question. Check whether the drop is isolated to one ad group, one device type, or one landing page variant before drawing any inference.
Check for creative fatigue. Refresh creatives when frequency exceeds 4 to avoid audience fatigue. High frequency with declining click-through rate is a reliable signal that your audience has stopped responding to the creative. The fix is new creative, not a budget increase.
Prioritise budget pacing against CpQL, not spend. If your weekly CpQL is tracking 20% above target by Wednesday, pausing the weakest ad sets before the weekend prevents overspend on underperforming traffic. Pacing decisions made on spend alone ignore efficiency entirely.
Flag channel prioritisation shifts. If Meta Ads are delivering CpQL at R420 and Google Ads are delivering at R780 for the same service, the data supports reallocating budget toward Meta. Document that decision in your report so the next review period has context.
Automate data pipelines where possible. Manual data gathering from multiple platform dashboards introduces errors and consumes time that should go toward analysis. Connecting your ad platforms to a centralised reporting environment means your team spends time interpreting data rather than copying it between spreadsheets.
Set a weekly insight cadence. Each week, your report should surface one finding, one decision made, and one test launched. This structure prevents reporting from becoming a passive exercise and keeps paid media analytics connected to campaign improvement.
Key takeaways
Effective paid media reporting connects advertising spend to business outcomes through tiered reports, reconciled data, and metrics that each carry a defined action threshold.
| Action | Details |
|---|---|
| Focus on outcome metrics | Track blended ROAS, CAC, and CpQL rather than clicks and impressions. |
| Tier your reports by audience | Daily for media buyers, weekly for directors, quarterly for executives. |
| Reconcile platform data daily | Platform conversions can overstate results by 30 – 50% without CRM reconciliation. |
| Link every metric to a decision | Each KPI needs a defined action threshold before the campaign launches. |
Why most paid media reports fail before they reach the boardroom
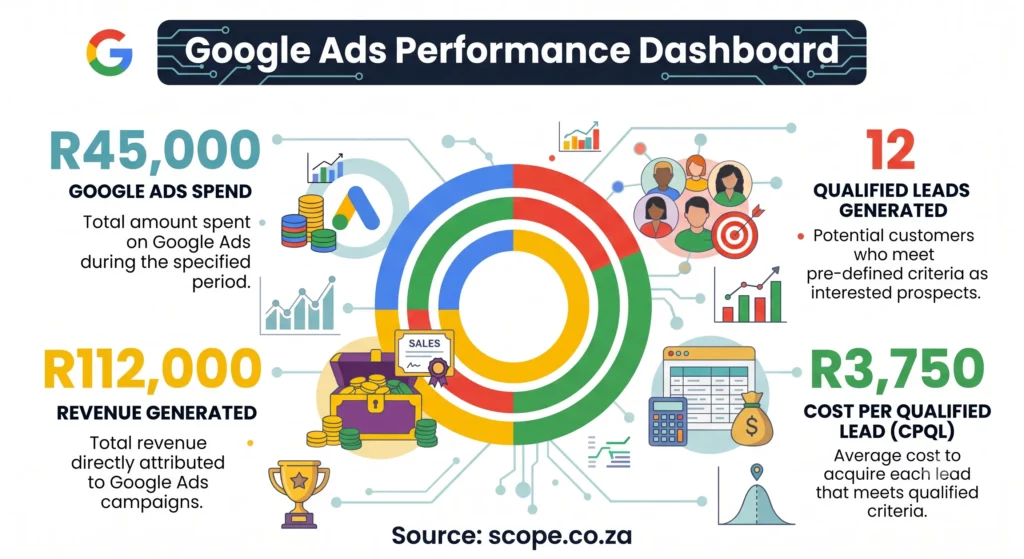
The shift I have seen make the biggest difference for service-based businesses is moving from platform-centric metrics to revenue-centric narratives. When a business owner sees that their Google Ads spend of R45,000 last month produced 12 qualified leads at a CpQL of R3,750, and that 4 of those leads converted at an average deal value of R28,000, the conversation changes entirely. They are no longer asking whether the ads are “working.” They are asking how to scale the channel that is producing R112,000 in revenue from R45,000 in spend.
Privacy changes and the decline of third-party cookies are making this harder, not easier. Attribution drift is real, and it will get worse. The businesses that build reconciliation workflows now, before the data becomes unreliable, will have a significant advantage. Those that continue relying on platform dashboards alone will find themselves defending numbers that do not match their CRM.
– Warren
Paid media reporting support from SCOPE
Reporting is only as useful as the decisions it produces. SCOPE is a Cape Town-based digital marketing agency specialising in Google Ads and Meta Ads for service-based businesses. We build custom reporting frameworks that connect your ad spend to qualified leads, pipeline contribution, and revenue, not just clicks and impressions.
If your current reports are not telling you whether your paid media is profitable, or if you are spending time gathering data instead of acting on it, get in touch with the SCOPE team. We will audit your current reporting setup and show you exactly where the gaps are.
Frequently Asked Questions
What is paid media reporting?
Paid media reporting is the process of collecting and analysing paid advertising data to measure campaign performance against business outcomes. It connects ad spend to metrics like CAC, blended ROAS, and qualified lead volume.
What are the most important paid media KPIs to track?
The seven core KPIs for 2026 are blended ROAS, Customer Acquisition Cost, conversion rates by funnel stage, Cost per Qualified Lead, view-through conversions, Quality Score, and cross-platform incrementality.
Why do platform dashboards give inaccurate conversion data?
Platform dashboards count conversions based on their own attribution models, which can overstate results by 30–50% due to cross-device tracking and double-counting. Reconciling platform data with CRM or backend sales records daily corrects this.
How often should paid media reports be produced?
Ad-level reports should be reviewed daily by performance marketers, channel-level reports weekly by marketing directors, and executive-level reports quarterly by business owners and senior leadership.
What is incrementality testing in paid media?
Incrementality testing uses holdout groups to measure the net lift a campaign generates above what would have occurred organically. It confirms whether paid media is driving new revenue or simply claiming credit for existing demand.